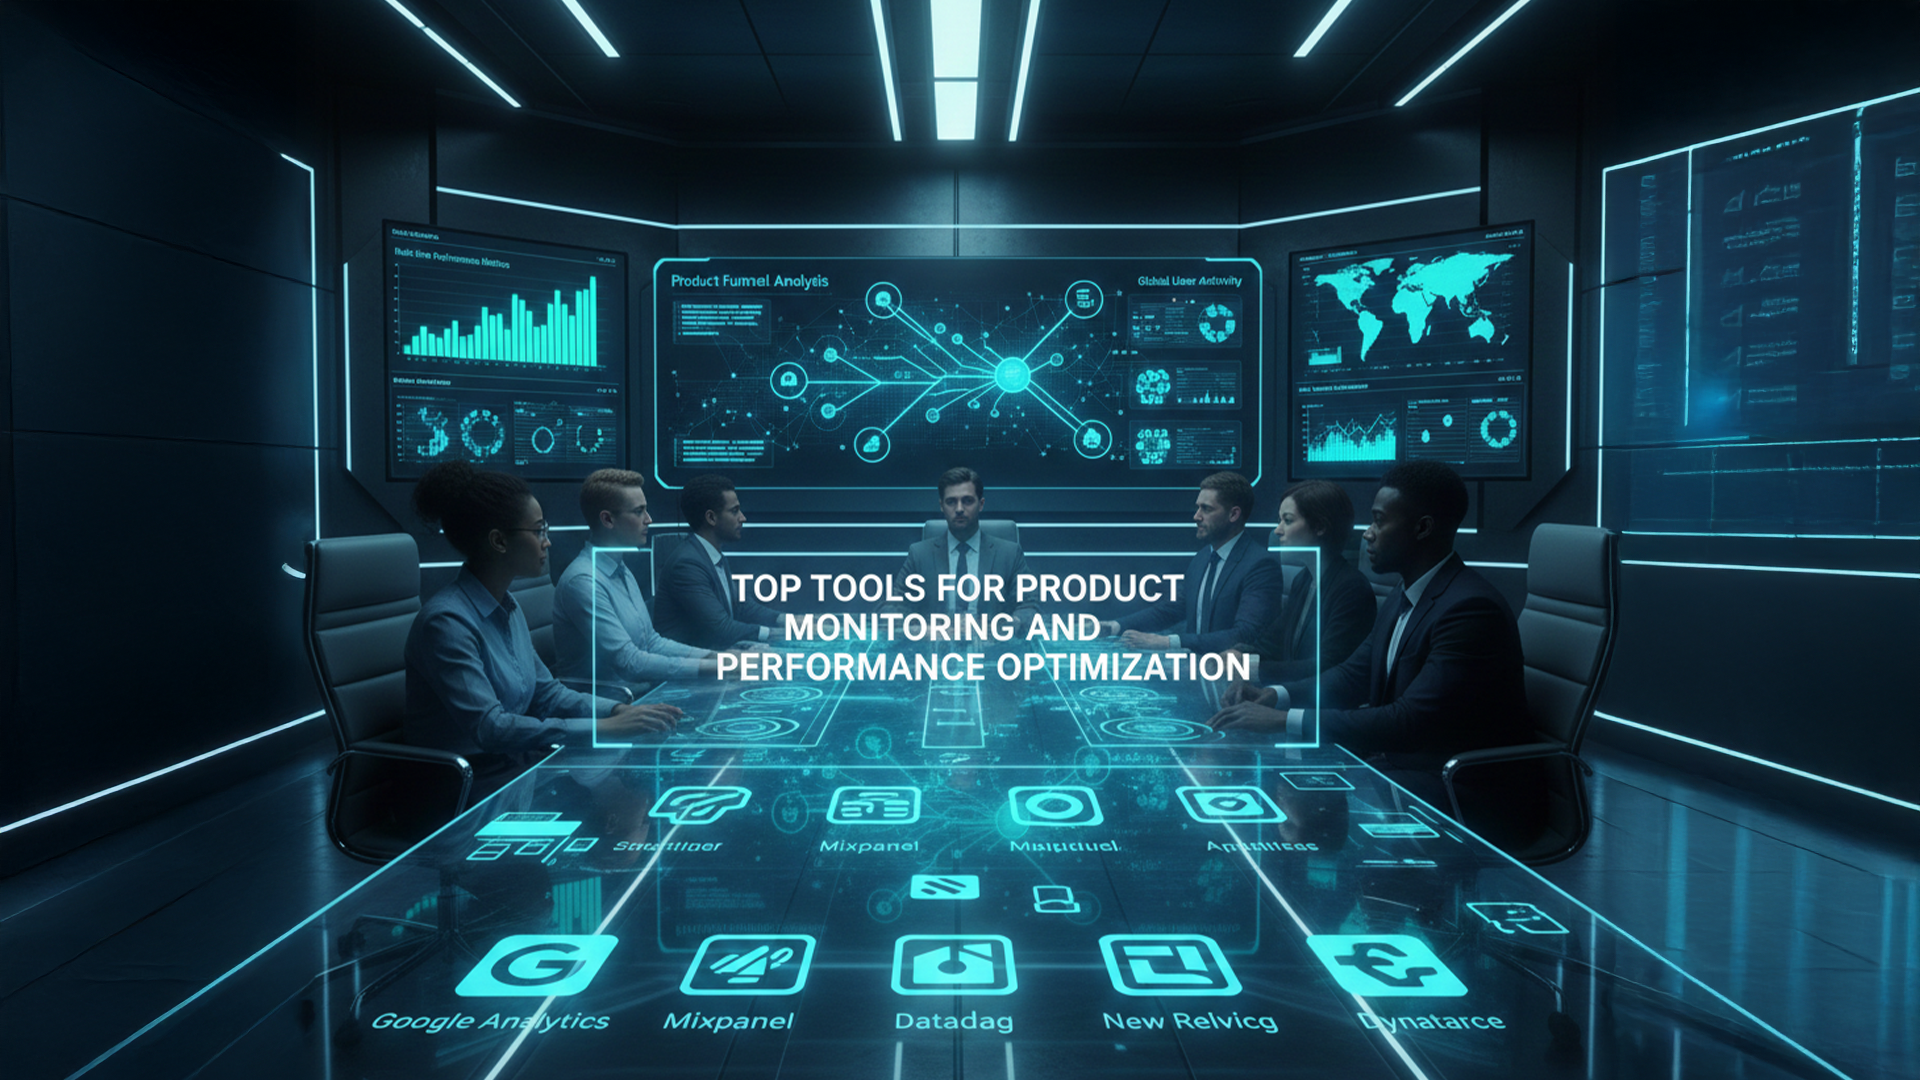
In today’s fast-moving digital landscape, users expect fast, reliable, and seamless product experiences. Whether you’re building a SaaS platform, mobile app, or enterprise solution, product monitoring and performance optimization are essential for ensuring stability, scalability, and long-term success.
Modern engineering teams rely on a wide range of tools to observe system behavior, diagnose issues, track user interactions, and optimize performance in real time. This article covers the top global tools for monitoring, logging, analytics, and performance optimization, helping product leaders and engineering teams choose the right solutions for their specific needs.
Why Monitoring and Optimization Matter
As products scale, complexity increases. More users, features, APIs, and integrations result in a higher risk of performance degradation. Monitoring tools help teams:
- Detect issues before users notice them
- Improve uptime and reliability
- Optimize resource usage and reduce costs
- Understand user behavior and product performance
- Maintain healthy architectures in both monolithic and microservices environments
Companies that invest in robust observability systems experience faster development cycles, fewer outages, and enhanced user satisfaction.
1. Datadog – End-to-End Observability Platform
Datadog is one of the most widely used tools for monitoring cloud applications at scale.
Key Capabilities
- Infrastructure monitoring
- APM (Application Performance Monitoring)
- Log management
- Real-time dashboards
- Alerts & anomaly detection
Best For
Startups and enterprises managing complex cloud-native environments or microservices. Datadog gives teams a unified view of performance across all layers.
2. New Relic – Full-Stack Application Performance Monitoring
New Relic provides powerful insights into application performance, dependencies, and bottlenecks.
Key Capabilities
- APM with detailed code-level insights
- Error tracking and distributed tracing
- Browser and mobile performance monitoring
- Synthetic monitoring
Best For
Engineering teams that need deep diagnostics to improve performance and identify slow transactions or backend issues.
3. Grafana – Open-Source Dashboarding & Visualization
Grafana is globally known for its flexibility and beautiful visualizations.
Key Capabilities
- Custom dashboards
- Integration with Prometheus, Loki, Graphite, InfluxDB, and other data sources
- Alerting systems
- Real-time metrics visualization
Best For
Teams that want full control over their observability stack using open-source tools.
4. Prometheus – Leading Metrics Collection System
Prometheus is widely used for monitoring cloud-native and microservices environments, especially with Kubernetes.
Key Capabilities
- Time-series metrics collection
- Powerful query language (PromQL)
- Alerts via Alertmanager
- Horizontal scalability
Best For
Engineering teams using Kubernetes or distributed microservices architectures.
5. AWS CloudWatch – Native AWS Monitoring Tool
For products built on AWS, CloudWatch offers seamless integration and highly cost-effective monitoring.
Key Capabilities
- Logs & metrics
- Custom alarms
- Infrastructure health monitoring
- Event-driven automation
Best For
Teams heavily invested in AWS infrastructure that want native monitoring and cost optimization.
6. Sentry – Error Monitoring and Application Health
Sentry is widely used to detect and track application errors in real time.
Key Capabilities
- Error tracking for frontend and backend
- Release health insights
- User session monitoring
- Performance tracing
Best For
Fast-growing startups that want to improve stability and quickly resolve application errors.
7. Google Analytics 4 (GA4) – Product Usage Analytics
Understanding how users interact with your product is vital for optimization. GA4 provides behavior analytics to support data-driven decisions.
Key Capabilities
- User journey tracking
- Engagement metrics
- Retention & cohort analysis
- Event-based measurement
Best For
Product teams, growth teams, and startups are focused on improving user experience and engagement.
8. Hotjar – Behavioral Insights & Heatmaps
Hotjar helps you understand how users behave on your platform visually.
Key Capabilities
- Heatmaps
- Session recordings
- Feedback widgets
- Conversion funnel insights
Best For
UX, design, and product teams are optimizing user flows and drop-off points.
9. Kibana + Elasticsearch – Log Analytics and Insight Visualization
This stack is widely used for centralized logging and advanced search capabilities.
Key Capabilities
- Full-text log search
- Custom dashboards
- Log aggregation and anomaly detection
- Security event monitoring
Best For
High-volume applications need fast log search and real-time insights.
10. Postman + API Monitoring
For API-driven products, Postman’s monitoring features help ensure stable API performance.
Key Capabilities
- API uptime checks
- Performance testing
- Automated workflows
- Error detection
Best For
Teams are relying on internal or external APIs for their core functionality.
How to Choose the Right Tools for Your Startup
Selecting the ideal monitoring and optimization tools depends on several factors:
1. Product Architecture
- Monolithic apps may require simpler, full-stack monitoring tools.
- Microservices benefit from distributed tracing and granular observability.
2. Team Size & Skillset
- Smaller teams may prefer fully managed platforms (Datadog, New Relic).
- Skilled DevOps teams may lean toward open-source (Prometheus, Grafana).
3. Budget Constraints
- Cloud-native tools offer pay-as-you-go options.
- Open-source solutions reduce cost but require more management.
4. Stage of the Startup
- MVP stage: lightweight, essential monitoring.
- Growth stage: full observability stack with alerting, tracing, and logging.
How Rezolut Infotech Helps Startups Implement Monitoring Systems
At Rezolut Infotech, we design and deploy monitoring and performance systems that match each startup’s architecture, scale, and business objectives.
Our approach includes:
1. Monitoring Strategy & Tool Selection
Based on your product maturity, traffic, and tech stack.
2. End-to-End Observability Setup
Metrics, logs, traces, dashboards, and alerts across all environments.
3. Real-Time Performance Optimization
Identifying slow endpoints, memory leaks, inefficient queries, and scalability risks.
4. Cloud Cost Optimization
Ensuring your infrastructure remains efficient as your product grows.
5. Ongoing Monitoring & Engineering Support
We help teams maintain reliability, improve uptime, and prevent bottlenecks.
With the right tools and processes in place, startups can scale confidently and deliver consistent, high-quality user experiences.
Conclusion
Product monitoring and performance optimization are no longer optional – they are foundational for growth. With users demanding reliability and speed, the tools you choose will directly influence product stability, customer satisfaction, and long-term scalability.
Whether your startup is building an MVP or operating a global platform, the right observability strategy will help you stay ahead of performance challenges and maintain a competitive edge.


